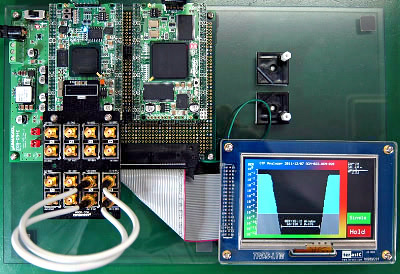
This is a demonstration of drwaing hi-speed transceiver's BER(Bir Error Ratio) bathtub curve using XCM-020 (Xilinx, Spartan-6 LXT) and ACM-022 (Altera, Cyclone III).
Components
|
|
|||
| Spartan-6 LXT FPGA Board | XCM-020 | HuMANDATA | |
| Cyclone III FPGA Board | ACM-022 | HuMANDATA | |
| SIF40 to SMA Conversion Board | ACC-009 | HuMANDATA | |
| 4.3 inch LCD Touch Panel | TRDB-LTM (Discontinued) | Terasic UTL-021 is alternative product  5″ Color LCD Display Module with Touch Panel 5″ Color LCD Display Module with Touch Panel |
|
System Architecture
XCM-020 hi-speed transceiver received data and calculated its BER. ACM-022 received the BER data and drew bathtub curve on the LCD monitor.
They communicate by SPI. ACM-022 give XCM-020 a sampling point and XCM-020 simply back its ratio value.
Because the datas are compared after 8B10B conversion, the error is not counted by bit but by byte.

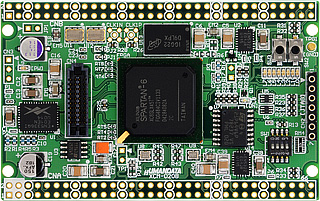 +
+ 
FPGA internal architecture (XCM-020)
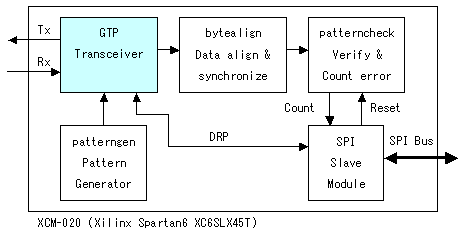
= GTP Transceiver
-2.5Gbps, No protocol, Reference Clock:125MHz, Comma: K28.5
-Sampling Point is flexible for SPI Slave Module
= bytealign
Byte order alignment and synchronized with Comma character
= patterngen
Generate PRBS transmit data
= patterncheck
Compare a received data and transmitted data.
Count total receive data and error
FPGA internal architecture (ACM-022)
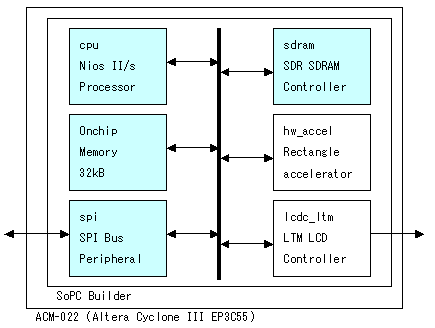
= Nios IP is running on ACM-022. SPI Master give instructions to the XCM-020 SPI slave.
Result
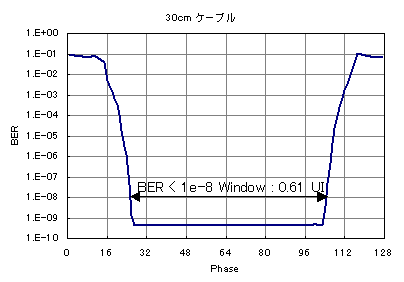
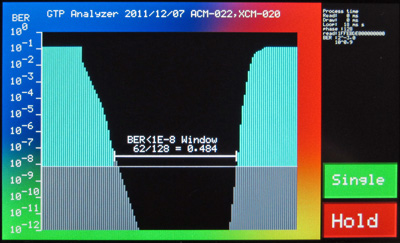
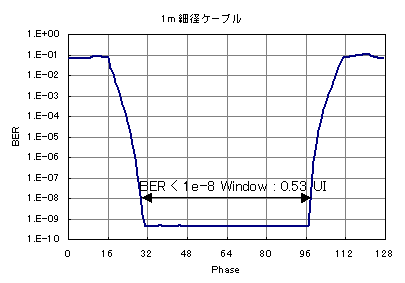
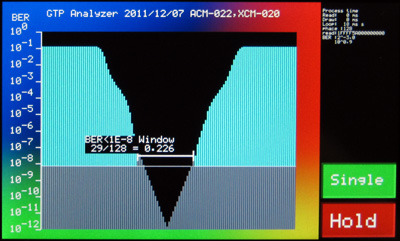
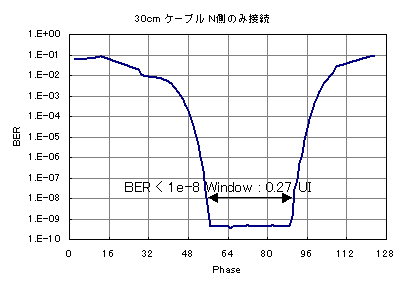
X-axis shows sampling point phase (128 step) and Y-axis shows error ratio. It is takes about 70msec per sampling point.
Blue color bars indicate actual measurement results (10E-8 and higher) and gray color bars indicate inference value basing on steepness of blue bars.
Results of Xilinx Chipscope IBERT are showed for reference. (tested with PRBS-7bit data)
peak of spectrum has its width and has two or three points of large volume of spectrum data around of the top-edge. You cannot use the biggest four peak values when you seek the peaks. In this demo, the bigger "local maximum points" (derivation value change from plus to minus) are chose as the peaks.
- Loopback (FPGA: Near End Loopback)
| GTP Analyzer | IBERT |
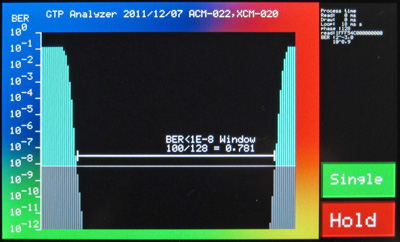 |
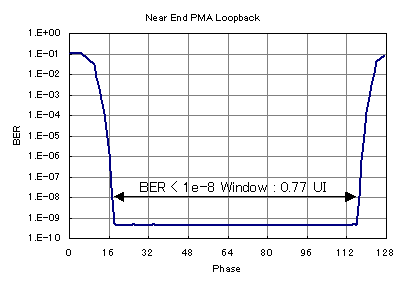 |
- 30cm Coaxial SMA Cable Loopback
| GTP Analyzer | IBERT |
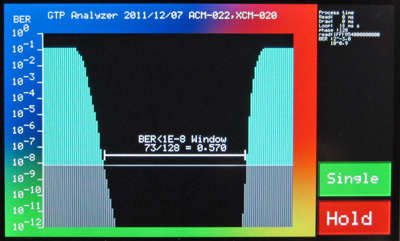 |
 |
- 100cm Coaxial SMA Cable Loopback
| GTP Analyzer | IBERT |
 |
 |
- 30cm Coaxial SMA Cable Loopback (N-channel only)
| GTP Analyzer | IBERT |
 |
 |
Application
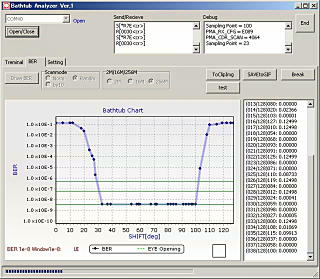
BER captured into PC via USB I/F and drew as a bathtub curve.
Youtube 
(in debugging)
Design files
Please be forewarned that we do not offer sample design files.
[ ]


