Simple FFT Analyzer Ver.2 / 50MHz FFT Spectrum Analyzer
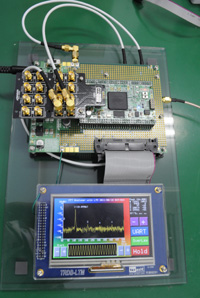
This is an FFT spectrum analyzer demonstration using ACM-024, Altera Cyclone IV GX FPGA board, and Liner Technology's LTC2274 evaluation board.

This demo is volved by AD/DA demonstration. Signal of function-syntheshizer is transformed using Altera's FFT module and drew on Terasic 4.3inch LCD touch panel. This demo is consist of Waveform viewer, 4 point peak detect, display overlay mode and display range configure modes. It takes about 10.24usec to transform data. The sampling rate of A/D converter is 100MHz/16bit and 1024 sample 512 point level sample.LTC2274 outputs AD converted data in 8B10B encoded serial data, so it is easy to apply to FPGA high serial I/F (HS Transceiver).
This demonstration is just an example for reference.
Components
 |
|||
| Cyclone IV GX FPGA Board | ACM-024 | HuMANDATA | |
| SIF40 to SMA Conversion Board | ACC-010 | HuMANDATA | |
|
A/D Converter (Fixed on bottom of PCB panel) |
LTC2274 Evaluation board | Liner Technology | |
| Multi Functon Synthesizer (SG) | WF1965 | NF Corporation | |
| 4.3 inch LCD Touch Panel | TRDB-LTM (Discontinued) |
Terasic UTL-021 is alternative product  5″ Color LCD Display Module with Touch Panel 5″ Color LCD Display Module with Touch Panel |
|
| Download cable | Terasic Blaster | Terasic | |
System Architecture

Output signal of WF1965 is A/D converted by LTC2274 and serialized into 8B10B format. ACM-024 provides 100MHz clock to LTC2274 as sampling clock and for synchronizing.
FPGA internal architecture

The ALTGX receives serial data and align the data in correct order by the bytealigner. Before FFT transforming, window function is applied to data to reduce its amount. After that, peripheral module added to Nios processor receives the data.

LED display is drew by Nios. LCD pixel data is should be sent at high rate and continiously. A LCD controler sends data from DDR2 memory to LCD in DMA transfer. Rectangular fill is also be processed by hardware to improve display reflesh speed.
Peak Detection
A peak of spectrum has its width and has two or three points of large volume of spectrum data around of the top-edge. You cannot use the biggest four peak values when you seek the peaks. In this demo, the bigger "local maximum points" (delivation value change from plus to minus) are choosed as the peaks.
Overlay mode
In normal operation, previous spectrums are deleted by filling with background black color. In overlay mode, filling process (and peak detect) is disabled to keep old data displayed.
Variable View range
Minus and plus buttons change the spectrum view range. When its are touched, looking is concaved to indigate users it is sensing.
With Spectrum analyzer
Demo spectrum(above) and 6GHz spectrum analyzer spectrum (bottom).

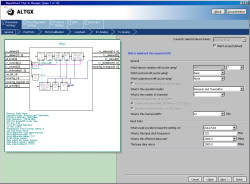
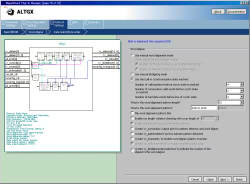
ALTGX Configuration
- Rate:2Gbps
- Reference clock : 125MHz (Onboard)

- Rate Match FIFO: Enable
- Skip Pattern: K28.5
- Control Pattern: K28.5

Design files
Please be forewarned that we do not offer sample design files.
[]


